I love the Thinkorswim platform — it’s easily one of the best day trading platforms available. There’s a reason it has won so many awards and why Schwab paid millions to acquire it. But even the strongest platforms have blind spots.
For example, Thinkorswim doesn’t show your all‑time P/L, and Schwab makes this information surprisingly hard to find. Their 6‑month change metric is also misleading because it includes cash transfers. And waiting until February for a 1099 just to understand your realized gains and losses slows down any trader trying to stay ahead. Yes, short‑term gains and losses depend on holding duration and wash rules, but you should still be able to estimate them.
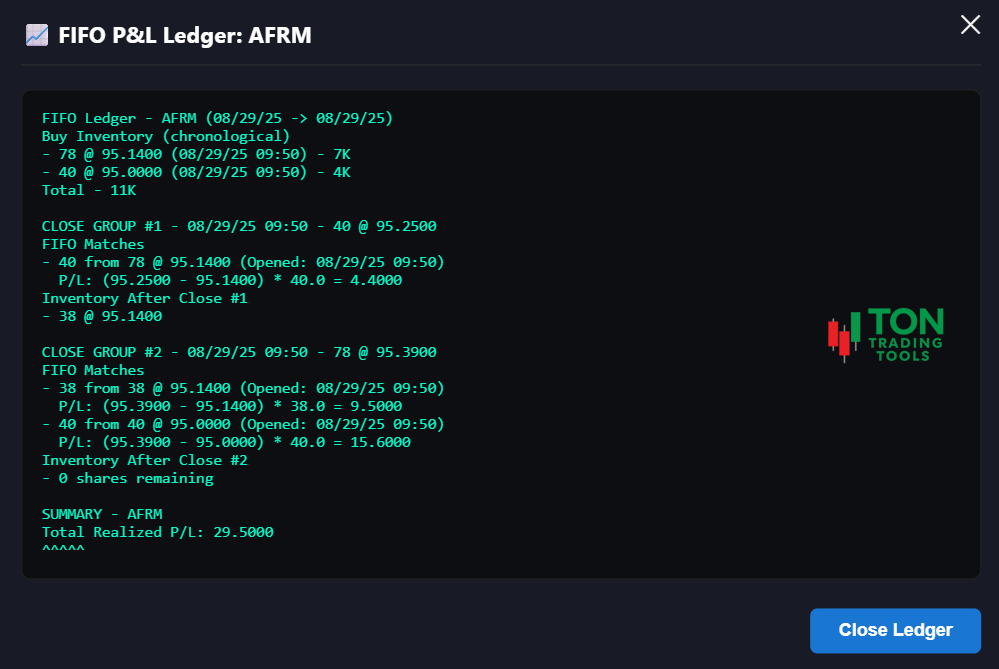
Another issue is the lack of a clear FIFO ledger. Traders who want to understand how their gains and losses are actually calculated often have to dig through statements or manually reconstruct their trade sequence. To help with this, I’ve documented how FIFO works and why it matters here:
TonTradingTools solves these gaps. No more digging through end‑of‑year statements or juggling messy spreadsheets. With a single click, you can see your all‑time P/L and instantly toggle between YTD and lifetime performance.
Simple. Accurate. Immediate — exactly what active traders need.
Screenshot of Ledger – on the tags screen